Back
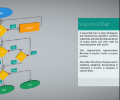
K-12 Flow Chart
by Laval
$1,290
Details
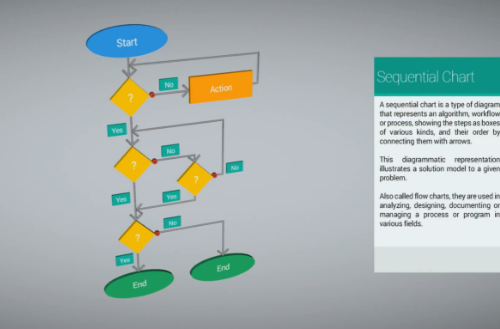
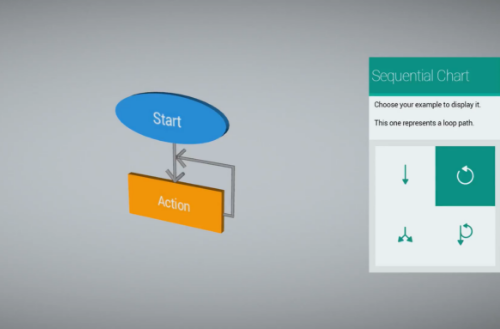
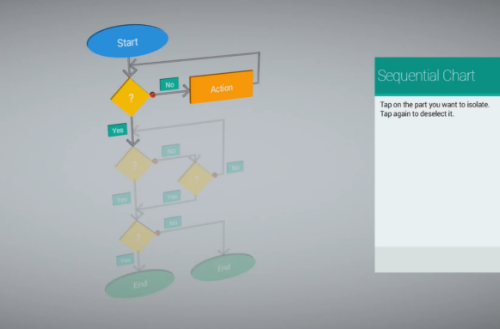
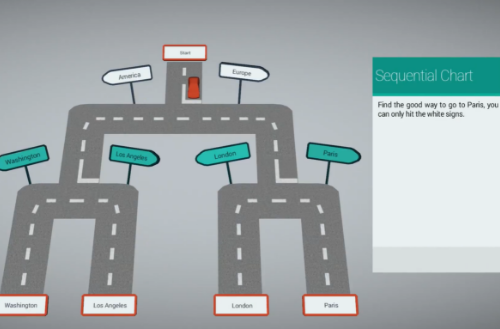
A sequential chart is a type of diagram that represents an algorithm, workflow or process, showing the steps as boxes of various kinds, and their order by connecting them with arrows. They are used in analyzing, designing, documenting, or managing a process or program in various fields. The virtual aspect of this chart allows its user to interact with and visualize their data set easily.
Device

Mobile