Back
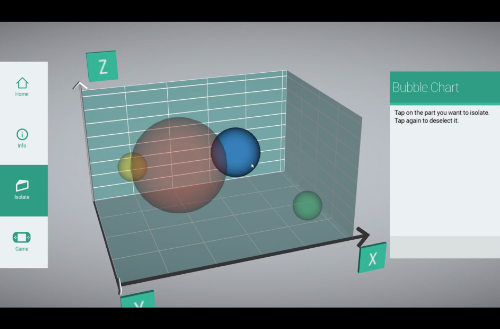
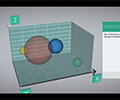
K-12 Bubble Chart
by Laval
$1,290
Details
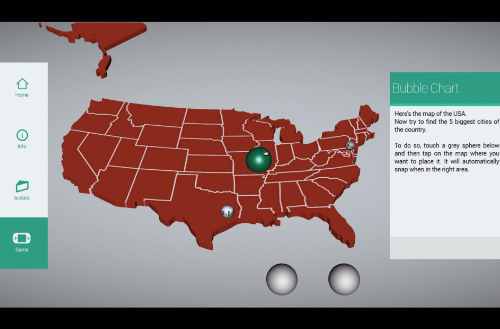
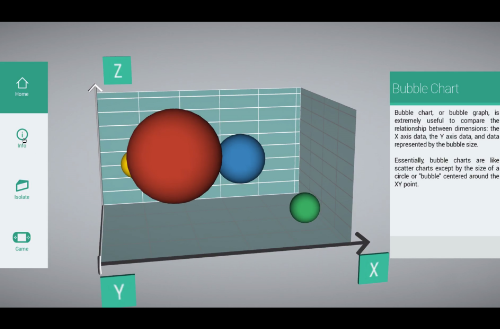
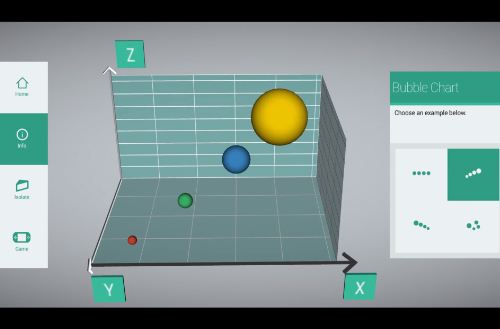
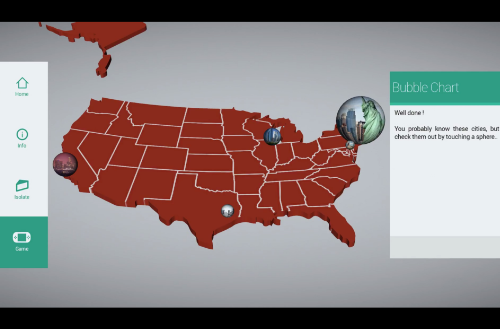
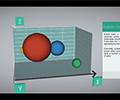
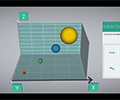
This virtual bubble chart is extremely useful to compare the relationship between dimensions: the X axis data, the Y axis data, and data represented by the bubble size. The virtual aspect of this chart allows its user to interact with and visualize their data set easily.
Device

Mobile