Back
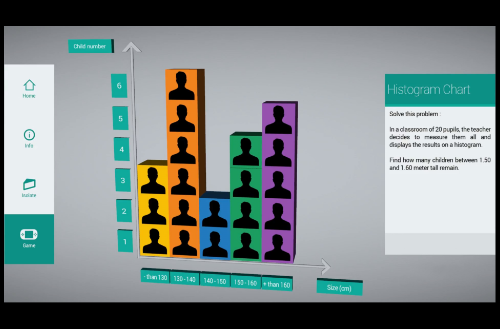
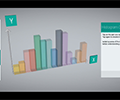
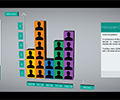
K-12 Histogram Chart
by Laval
$1,290
Details
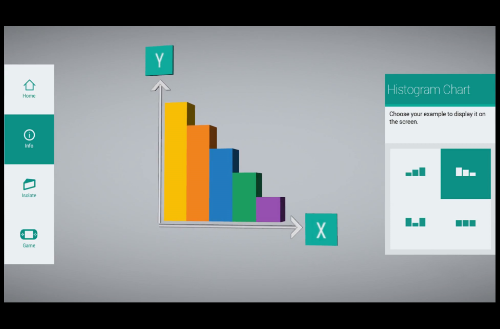
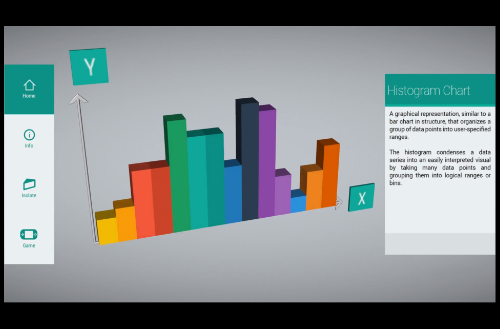
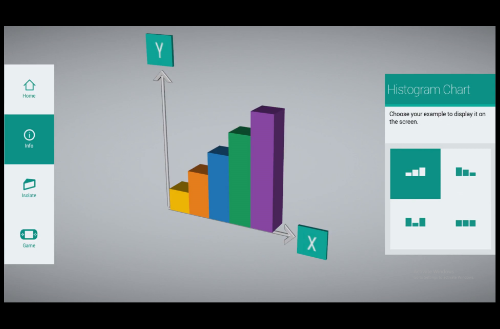
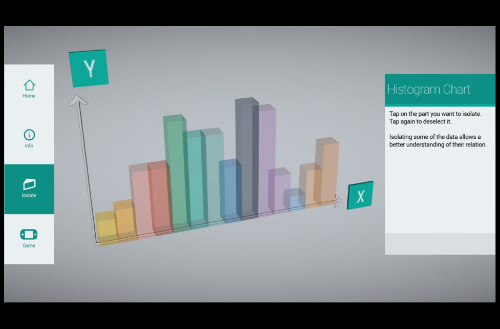
This virtual histogram chart is similar to a bar chart in structure that organizes a group of data points into user-specified ranges. The histogram chart condenses a data series into an easily interpreted visual by taking many data points and grouping them into logical ranges or bins. The virtual aspect of this chart allows its user to interact with and visualize their data set easily.
Device

Mobile